
When it comes to determining whether something is a successful innovation, there is one absolutely crucial test: Does it create value? That value may come in many forms. Usefulness for the customer, profits for a company, or social good for a nonprofit, but it must be there. Creating value isn’t always enough to produce traction and profitability, but without value creation there just isn’t any way to call something an innovation.
If there’s one thing we know about value creation, it is that it is not evenly distributed. Many attempts to create value fail or produce only modest results, while others (Google, Apple, Microsoft…) produce astronomical returns and benefits. It is the rare few that produce a hugely disproportionate share of new value.
Predicting who those few will be is notoriously difficult. Early stage investors, who make their living trying to do that, get it wrong 9 times out of 10. They’re only able to survive because the returns are so high on those few that they more than make up for the weak performance of all the others.
One of the truisms of early stage investing is that the most important criteria in making those guesses is the “who,” not the “what.” Yes, the idea needs to be good and yes, the potential market must me huge, but what matters most is whether the founder is the right person for the job. This simple reality has not fully sunk in when it comes to corporate innovation, where the emphasis still tends to be on ideas and process. Perhaps that’s because it’s been so difficult to evaluate the “who” without resorting to heuristics and subjective judgments—exactly the sort of criteria that would be immediately dismissed if someone tried to use them for any other due diligence.
There simply has not been any scientifically sound metric for reliably evaluating personal innovativeness (ahem…drum roll please) —until now.
Newly published research in the International Journal of Innovation Science shows that 1) it is possible to calibrate innovativeness, and 2) that metric is remarkably predictive of who will create the most value.
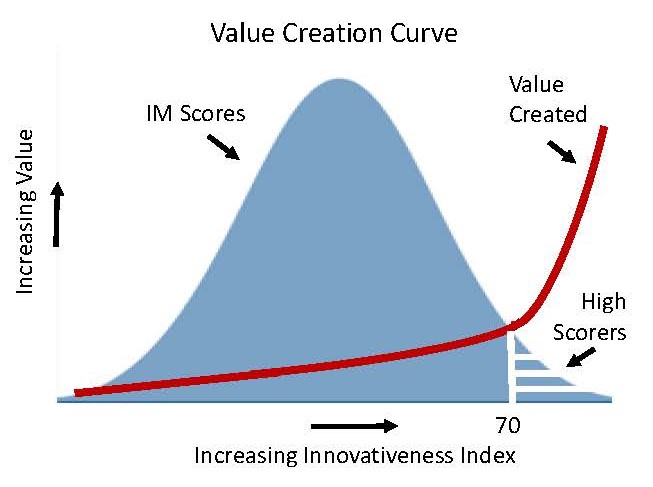
In my last post, Shifting the Odds of Innovation Success, I explained some research on hundreds of entrepreneurs. (Thank you to the Kauffman Foundation for making that study possible.) That research revealed that a founder’s score on the Innovativeness Index was a powerful predictor of whose ventures would produce the most profits (34x more), revenues (70x) and jobs (10x). Those are dramatic multiples but what’s interesting about the data is how it distributes that value. Scores on the Innovativeness Index fall into a statistically normal distribution, the classic bell curve. But value creation is extremely skewed. What is even more interesting is that even when the value created is measured in several different ways, the trend lines are similar—a hockey stick curve.
In each case, value creation tends to increase modestly most of the way along the range, then sharply accelerates at about three quarters of the way up the scale (at around 70). Only a few percent of founders scored above this threshold, but they produced the vast majority of total value. Among tech companies studied, these few high scorers (< 10%) created 65% of the value created by the tech ventures as a group. So measuring innovativeness provides a probabilistic estimate of who the high end outliers will be, and it does that with substantially higher accuracy than experienced early stage investors.
The same trend holds whether the dataset is diverse ventures (all entrepreneurs studied) or similar ones (a subset of tech ventures). And it holds whether value is measured as profits, revenues or jobs. This suggests that there is an underlying relationship that transcends any particular type of value or context. So this same pattern is likely to be found in other innovation settings—R&D, NPD, etc.
Anyone who has looked at graphs of things like people’s personal incomes or profits among companies has seen hockey stick distributions. They are sometimes called Pareto or power law distributions and they are quite common. What is new here is that measuring someone’s innovativeness predicts where they are likely to fall along such a distribution.
Still more intriguing is that innovativeness is not a personality or innate trait. It is a mindset and mindset can be changed. It is not news to any innovation manager that innovation talent is unevenly distributed. Yet, my work with this assessment of mindset has shown over and over that someone can learn to put themselves in that elite group of exceptionally high value innovators.
For articles on this research or to download a white paper providing an overview, go to http://InnovatorMindset.com/research/
In my next post, I’ll get into exactly what innovativeness means in this research.
Click edit button to change this text.
Leave A Comment